Field NDVI overlay
Cocoa sourcing zones map
Mavuno Intelligence · Agricultural AI Platform

AI that reads the field
before you lose the harvest.

54,000+ labeled crop images. Sentinel-2 satellite coverage. Three precision modules — trained on validated agronomic datasets and deployable across every layer of African agricultural value chains.

40%
Of harvests lost
to disease yearly
3
AI modules,
one platform
93%
Mean AUC-ROC
crop disease
10m
Satellite spatial
resolution
What it is

Precision intelligence
for the African field.

Most crop infections are invisible until 30–60% of the harvest is already compromised. At that point, treatment limits damage — but the loss is locked in. BAKAP DataLabs has built a three-module AI platform that detects disease from a smartphone photo in under 500ms, monitors field basins from orbit weekly, and scores agricultural loan risk with agronomist precision.

Trained on PlantVillage, the CGIAR-IITA African crop disease database, and ESA Sentinel-2 imagery — Mavuno Intelligence is the first AI platform built for the scale, the crops, and the economic stakes of sub-Saharan African agriculture.

CropScan Module · Leaf Analysis · Live Inference Scanning…
ANTHRACNOSE 0.91
RUST 0.74
HEALTHY 0.97
Leaf disease scan
Anthracnose · 0.91
Leaf Rust · 0.74
487ms inference
Disease zone flagged
Rust — secondary
Healthy tissue
AI Modules

Three specialized engines,
one unified platform.

From the individual plant leaf to the satellite basin to the financing desk — each module addresses a distinct layer of agricultural intelligence, deployable independently or combined.

Module 01 · Disease Detection
CropScan

Multi-label classification of crop leaves and fruits from smartphone photos. Detects the five highest-prevalence plant diseases with Grad-CAM heatmap localization. No lab. CPU-only. Offline mode available.

AnthracnoseLeaf BlightMosaic VirusLeaf RustRoot Rot
PlantVillage + CGIAR-IITA  ·  AUC ≥ 0.93
Module 02 · Satellite Monitoring
FieldWatch

Automated Sentinel-2 multispectral processing at 10m resolution. NDVI, NDWI, and EVI per parcel — updated weekly. Drought stress, flood detection, and yield trend alerts for basins up to 500,000 ha.

NDVI MappingDrought StressFlood DetectionYield Forecast
ESA Copernicus Sentinel-2  ·  10m · 5-day revisit
Module 03 · Risk Scoring
YieldScore

An automated agricultural risk score (0–100) per parcel, fusing CropScan alerts, FieldWatch satellite indices, and CHIRPS rainfall anomalies. Built for loan officers, insurance actuaries, and compliance teams.

Loan Risk ScoreInsurance TriggerClimate RiskHarvest Forecast
CropScan + FieldWatch + CHIRPS  ·  R² 0.87
Who it's for

Six sectors.
One irreplaceable asset.

Agribusiness cooperative
Agribusiness / Cooperative
"What is the real health of my cocoa basin right now?"

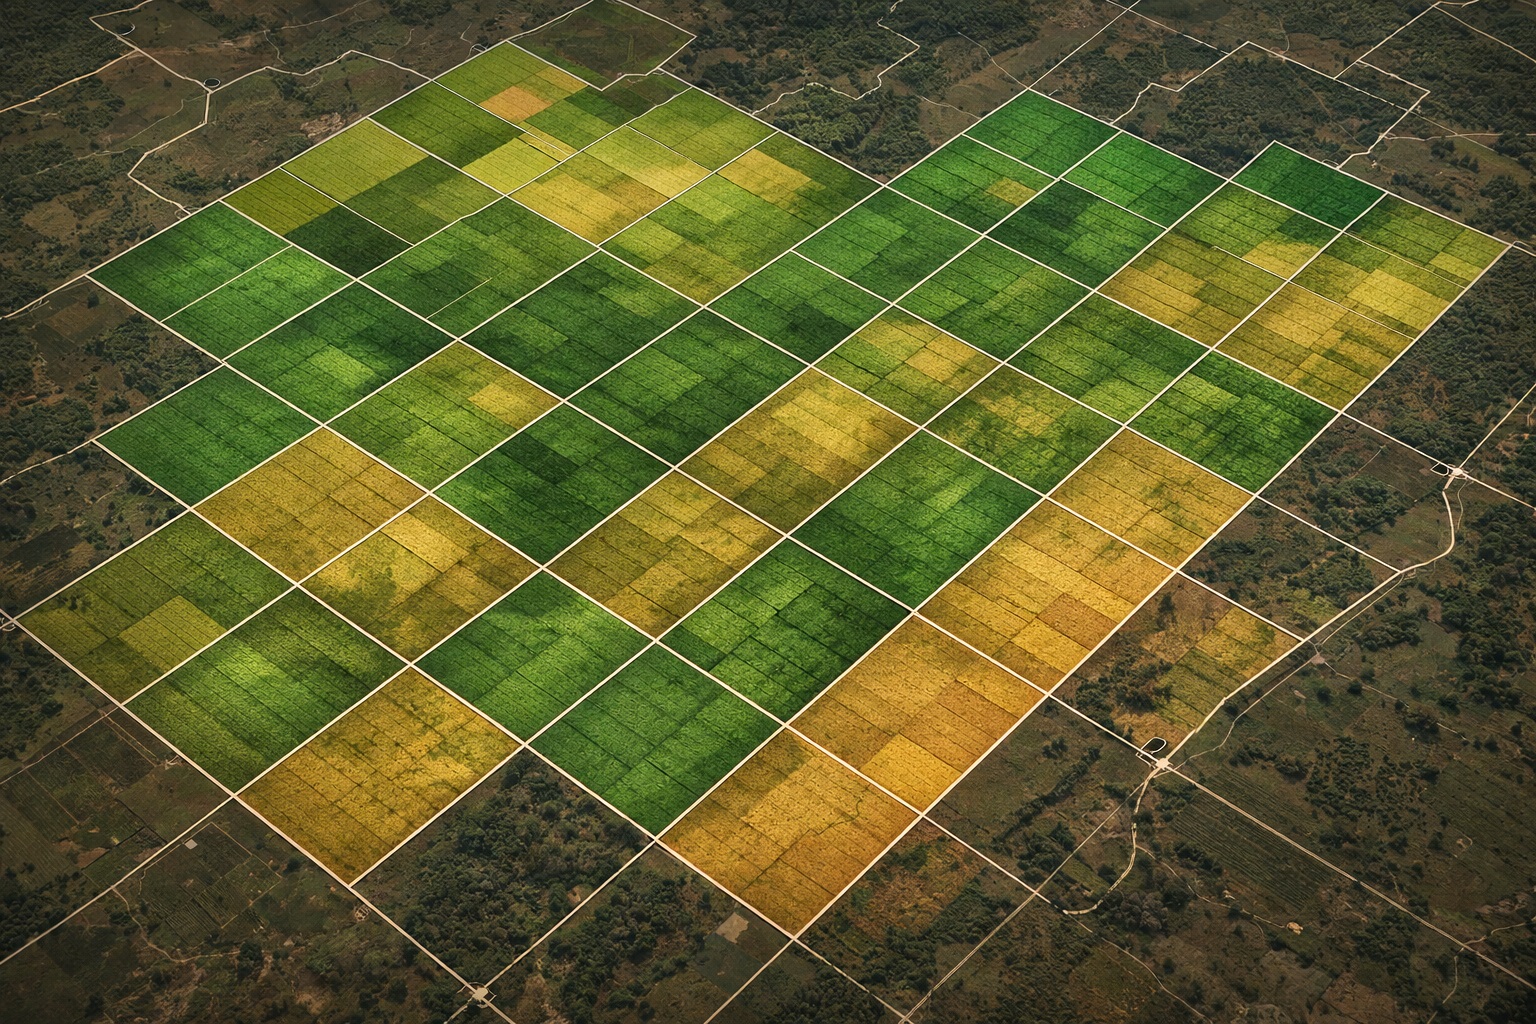
FieldWatch monitors your supply basin weekly. Any parcel with NDVI stress drop above 15% triggers an automatic geo-alert — weeks before harvest loss becomes irreversible. No field visit required for the initial triage.

Value: Early warning saves 20–35% of at-risk harvest
Development bank
Development Bank / MFI
"Does this agricultural loan carry real harvest default risk?"

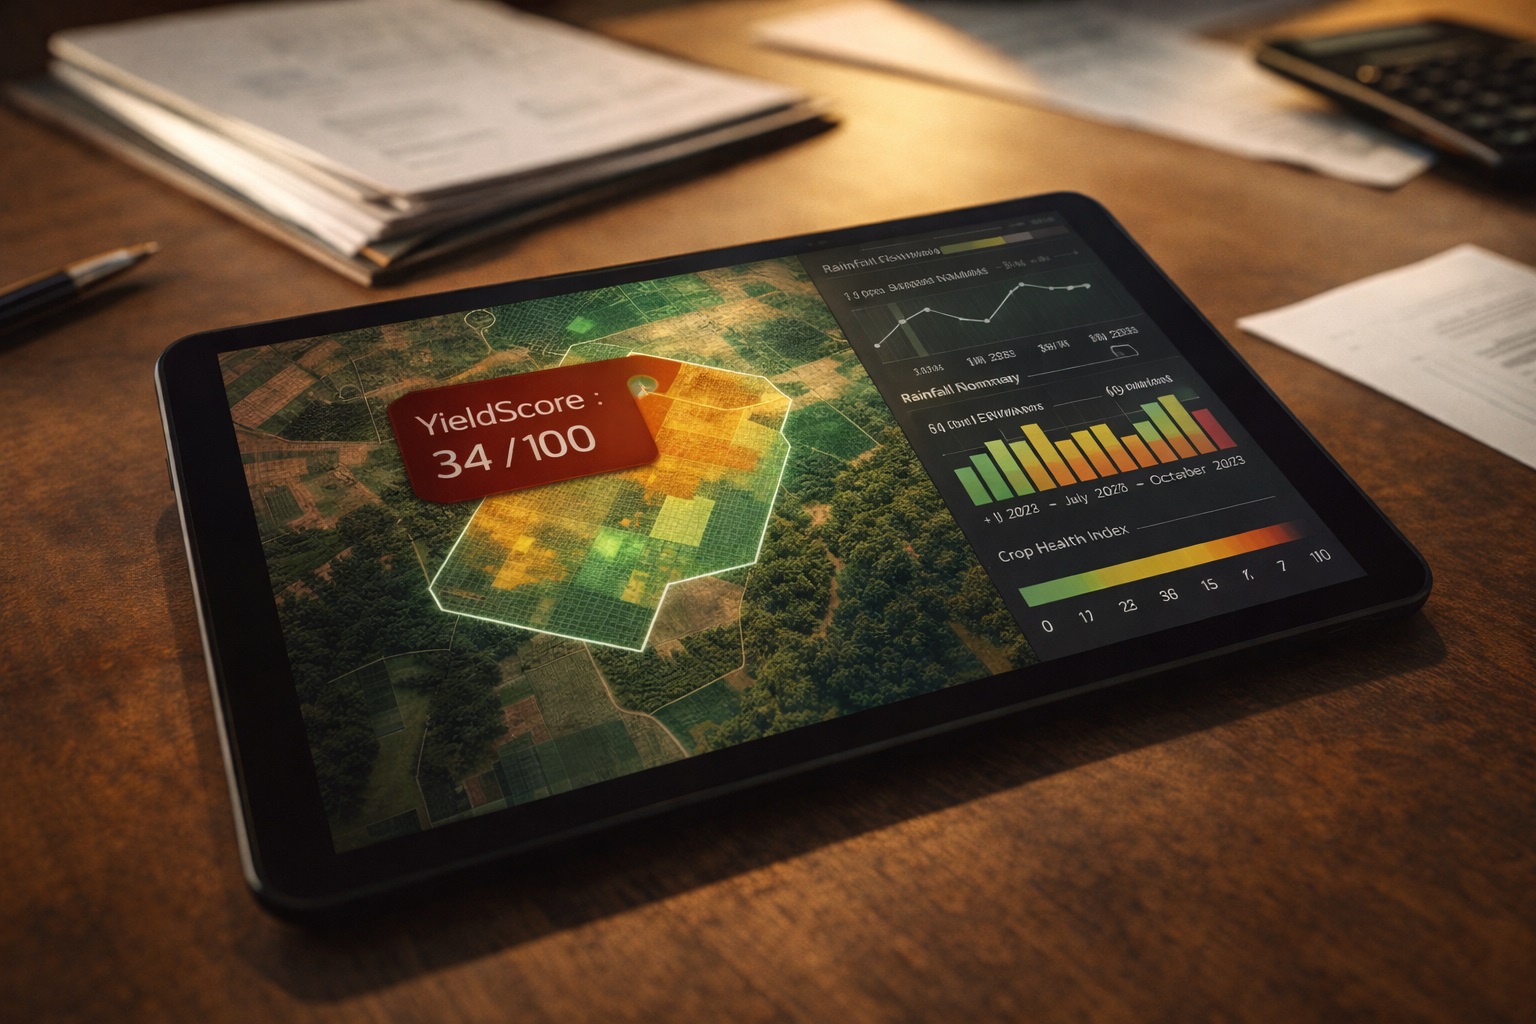
YieldScore generates a pre-disbursement parcel risk report: disease exposure, rainfall forecast delta, NDVI trend, and historical yield — compiled into a single 0–100 index for every loan in the portfolio.

Value: Agricultural NPL reduced by up to 40%
Agricultural insurer
Agricultural Insurer
"Did this farmer actually suffer a verifiable climate loss?"

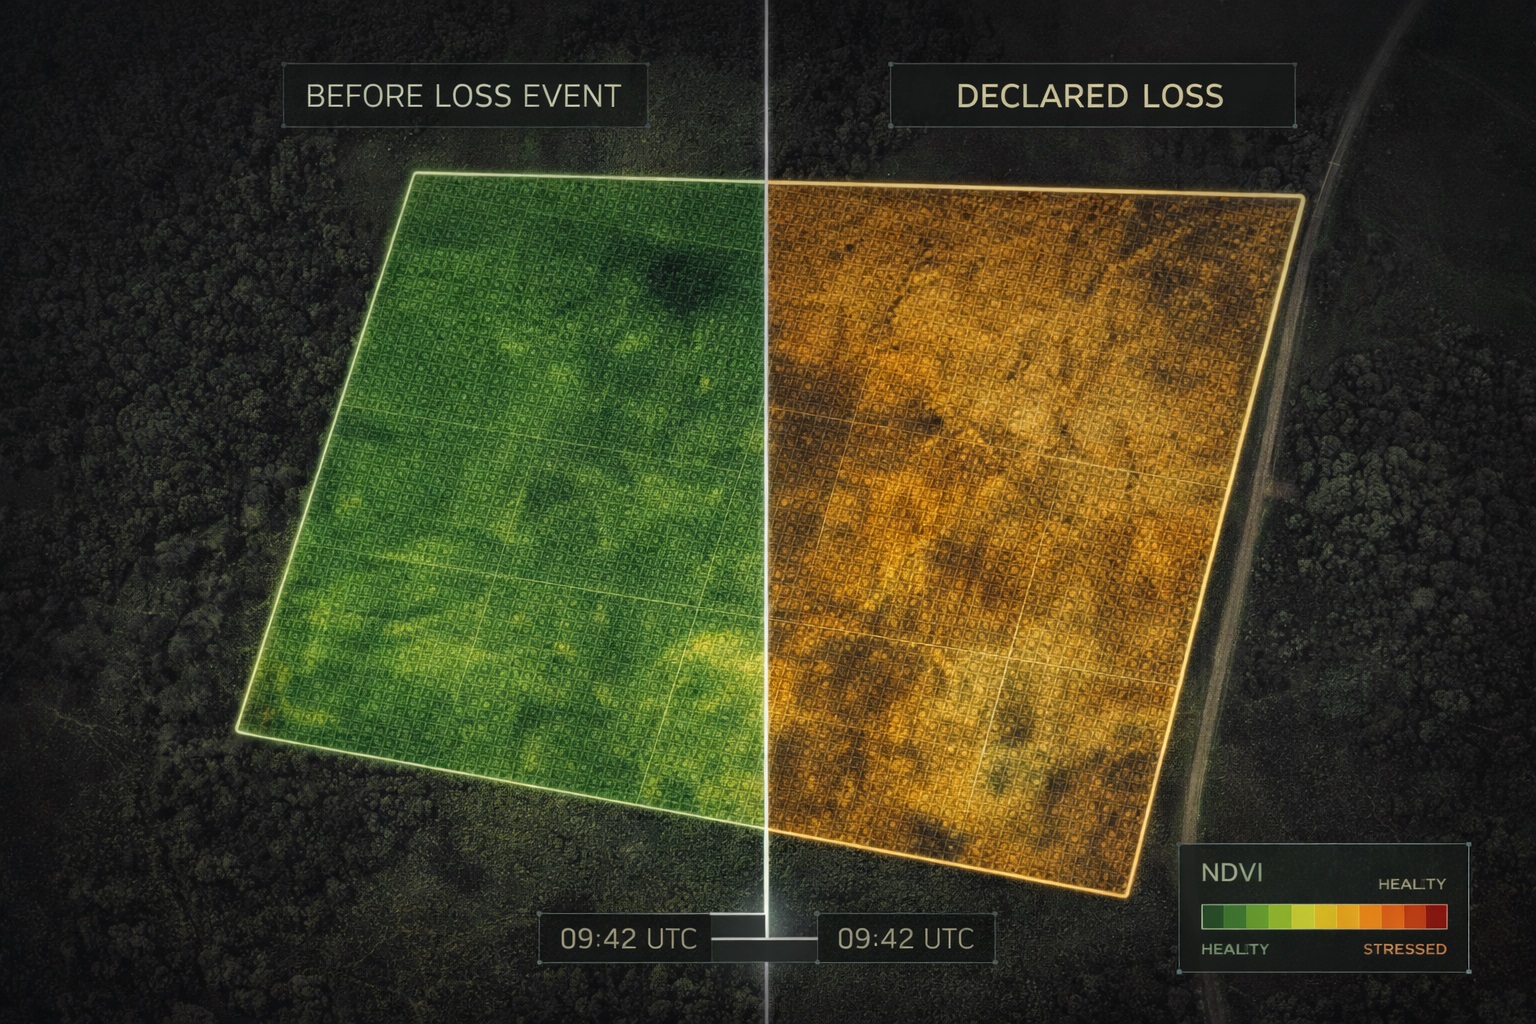
Index insurance claims validated automatically. FieldWatch compares NDVI trajectory before and after the declared loss against historical baseline — producing an audit-ready satellite evidence report. No field adjuster needed.

Value: Claims assessment cost cut by 65%
Export company
Export Company (Cocoa / Coffee)
"Will my sourcing zones deliver contracted quality this season?"

Cross your origin network against CropScan disease prevalence and FieldWatch seasonal forecasts. Identify high-risk origin zones 6–10 weeks before the harvest window and reallocate procurement before the quality penalty is written.

Value: Export quality penalties eliminated
NGO food security
NGO / Food Security Program
"Which zones are heading toward a food crisis in the next 90 days?"

Aggregate FieldWatch NDVI with rainfall anomaly data across entire provinces. Weekly predictive food insecurity maps — enabling pre-positioning of aid before a crisis becomes visible on the ground.

Value: 90-day early warning for food emergencies
Input company
Input Company (Seeds / Fertilizers)
"Where do my products generate measurable yield improvements?"

Cross your sales territory against FieldWatch yield performance maps to identify zones where your inputs demonstrably outperform competitors. Generate evidence-based agronomic performance reports for every distributor meeting.

Value: Territory performance evidence at field scale
The Invisible Threat

Every undetected infection
is a preventable loss.

The agronomist shortage means one specialist often covers 5,000+ farmers. Most crop disease goes undiagnosed until 30–50% leaf coverage — at which point the yield loss is already irreversible. Mavuno Intelligence gives every cooperative, loan officer, and field agent a diagnostic system that detects infection before the eye does.

Critical loss
Disease at late stage. 40–60% yield loss locked in. Treatment limits spread only.
Moderate loss
Visible symptom stage. 15–35% yield loss. Treatment recovers most of the harvest.
Early detection
CropScan flags infection pre-symptom. Targeted treatment. Yield loss under 5%.

Yield retained per crop — with vs. without early detection

Cocoa
38% — undetected
Coffee
44% — late detect
Maize
52% — moderate
Cassava
41% — undetected
+ Mavuno
94% — early detect
AI Architecture

State-of-the-art models,
field-validated.

CropScan runs EfficientNet-B4 fine-tuned on PlantVillage and CGIAR-IITA. FieldWatch processes Sentinel-2 Level-2A surface reflectance through a custom spectral pipeline. YieldScore fuses both with CHIRPS rainfall anomaly data in a gradient-boosted risk model.

01Image IngestionResize · CLAHE normalize · Multi-scale augment
02Feature ExtractionEfficientNet-B4 backbone · ImageNet pretrained
03Multi-label HeadBCEWithLogitsLoss · Sigmoid · 5-class output
04Spectral FusionB4/B8/B11 Sentinel-2 · NDVI · NDWI · EVI
05Risk Scoring APIJSON YieldScore · GeoJSON parcels · PDF export
# CropScan · EfficientNet-B4
Model(
  backbone="efficientnet_b4",
  pretrained=True,
  num_classes=5, # Anth·Blght·Msc·Rust·Rot
  dropout=0.4
)

# FieldWatch · Sentinel-2 Pipeline
ndvi = (B8 - B4) / (B8 + B4)
ndwi = (B3 - B8) / (B3 + B8)
evi = 2.5 * (B8 - B4) / (B8 + 6*B4 - 7.5*B2 + 1)

# YieldScore · Gradient Boosting
score = GradientBoostingRegressor(
  features=[ndvi, ndwi, cropscan_risk,
           chirps_anomaly, hist_yield_3yr]
)
Training Data

Four authoritative datasets,
rigorously validated.

Every model traces its training data to peer-reviewed, publicly auditable sources. No synthetic data. Full scientific reproducibility.

02 / AFRICAN CROPS
CGIAR-IITA
Int'l Institute of Tropical Agriculture · Nigeria

African-context crop disease imagery from Nigeria, Tanzania, Uganda, and DR Congo. Covers cassava mosaic, maize streak, and groundnut rosette — the three highest-impact diseases in sub-Saharan Africa.

Africa-specificCassava · MaizeField-collected4 countries
03 · 04 / SATELLITE + RAINFALL
Sentinel-2 + CHIRPS
ESA Copernicus · UCSB Climate Hazards Group

Sentinel-2 provides 10m multispectral imagery every 5 days. CHIRPS v2.0 supplies 35+ years of daily rainfall records at 0.05° resolution across Africa — feeding YieldScore's climate risk component directly.

10m resolution5-day revisit35yr rainfallOpen access
Validated Performance

Metrics that meet
agronomic standards.

All metrics on held-out test sets with stratified splits. Benchmarked against PlantVillage published baselines and FAOSTAT ground-truth yield survey data.

0.93
AUC-ROC · Disease Detection
CropScan on PlantVillage + CGIAR test set
0.91
AUC-ROC · Crop Stress
FieldWatch NDVI anomaly detection
0.87
R² · Yield Forecast
YieldScore vs. ground-truth harvest records
487ms
Avg. Inference Time
Per photo on CPU · Smartphone-compatible
"A late diagnosis in a field costs a season. An early one costs nothing but attention." BAKAP Mavuno Intelligence · Built to close the gap between data and the harvest.
Pricing

Pricing on request.
Tailored to your scale.

Every plan includes full dashboard access. Pricing is tailored to your basin size, number of users, and deployment model. We respond within one business day.

Starter
Cooperative
From — contact us
up to 3 users
  • CropScan disease detection module
  • Up to 1,000 photo inferences / month
  • Grad-CAM heatmap output per image
  • PDF diagnostic report per analysis
  • Web dashboard + offline mobile mode
  • Email support
Get Started
Enterprise
Finance & Insurance
Custom pricing
unlimited users
  • All three modules — CropScan + FieldWatch + YieldScore
  • Unlimited inferences + unlimited satellite coverage
  • Per-parcel loan risk scoring API
  • Index insurance trigger automation
  • Custom model fine-tuning on your crops
  • On-premise deployment available
  • SLA + dedicated ML agronomist support
Contact Sales
One-time · No subscription required
Field Intelligence Proof-of-Concept

Full CropScan + FieldWatch deployment on your infrastructure, validated on your actual crop basin. Delivered with YieldScore baseline report and staff training within 10 business days.

Scoped to your project
contact us for an estimate
Request Engagement
Get Started

Ready to deploy
agricultural intelligence?

Tell us your context — cooperative, bank, insurer, or exporter. We'll match you to the right modules and demo on your actual crop data.

No commitment. We respond within one business day.